Study on LIBS System published in Nature Scientific Reports
3 high-res maps per hour, +4500 measurements per minute
We are pleased to share the outcomes of our recent study, “Applying Laser Induced Breakdown Spectroscopy (LIBS) and Elemental Imaging on Marine Shells for Archaeological and Environmental Research,” published in Nature’s Scientific Reports:
Hausmann, N., Theodoraki, D., Piñon, V. et al. Applying laser induced breakdown spectroscopy (LIBS) and elemental imaging on marine shells for archaeological and environmental research. Sci Rep 13, 19812 (2023). https://doi.org/10.1038/s41598-023-46453-w
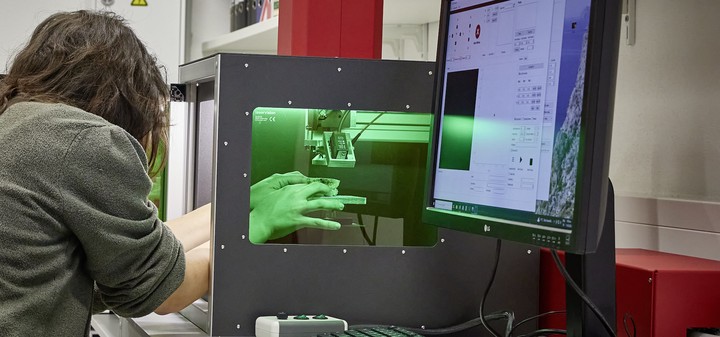
Our work centres on using LIBS to analyse marine mollusc shells, a method that has shown increasing importance in archaeological and geological research. This technique allows us to generate detailed Mg/Ca images on marine shells, correlating directly with seasonal sea temperatures and providing us with areas of interest for subsequent oxygen isotope analyses. Our main objective was to develop a LIBS system adaptable to existing laboratories for studying such hard-tissue samples.
Key Highlights from Our Study
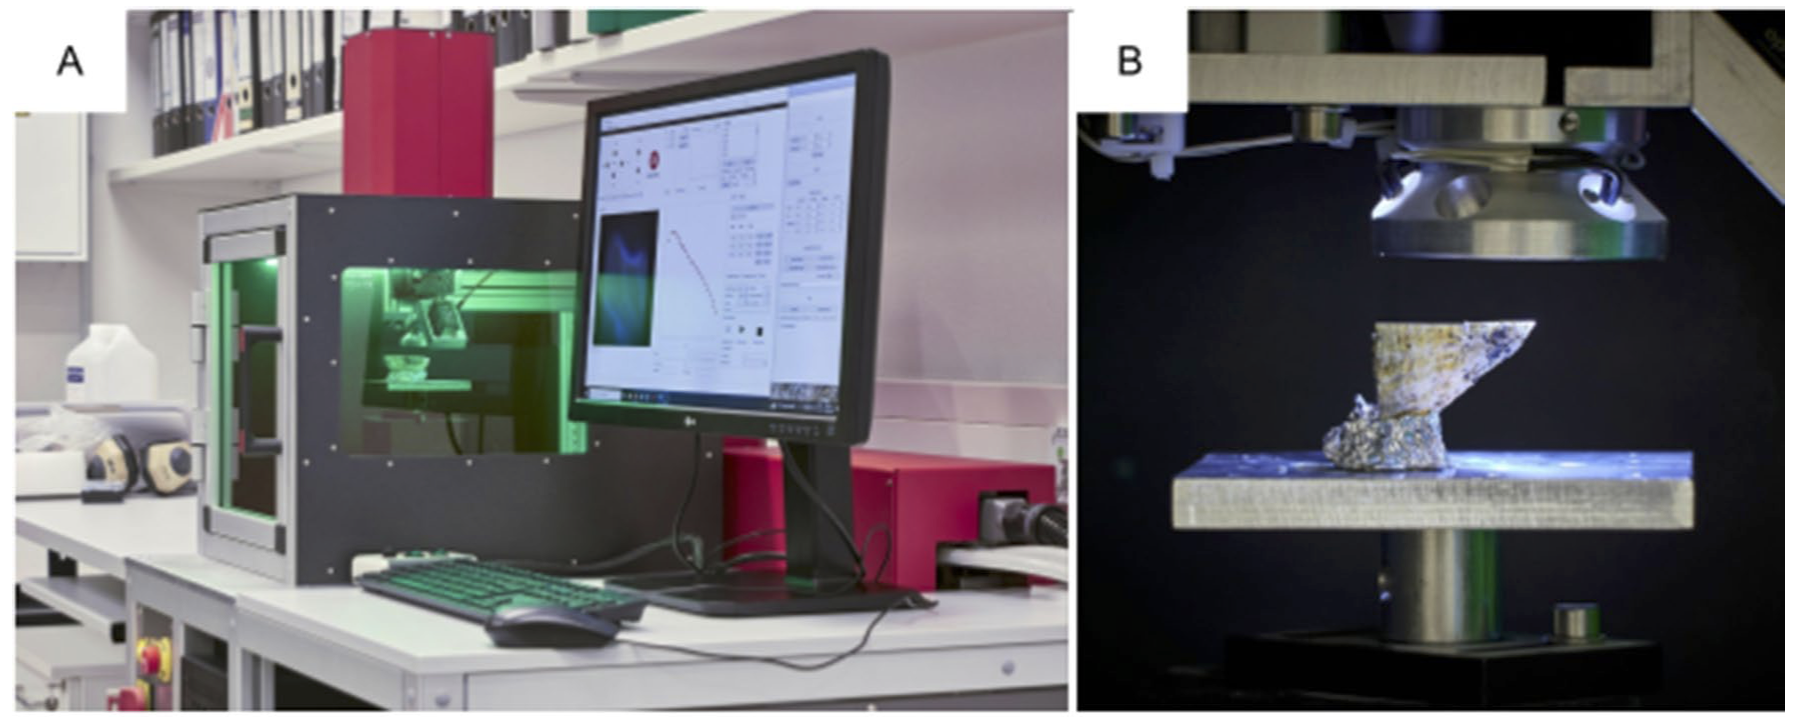
- Customised LIBS System: We developed a customised micro-LIBS system for real-world applications, demonstrating its efficiency in analysing marine mollusc shells.
- Wide-Scale Analysis: We analysed 101 shell specimens, producing 234 images. This high-throughput approach allowed us to study more samples with minimal destructive effects, opening new doors for further analyses.
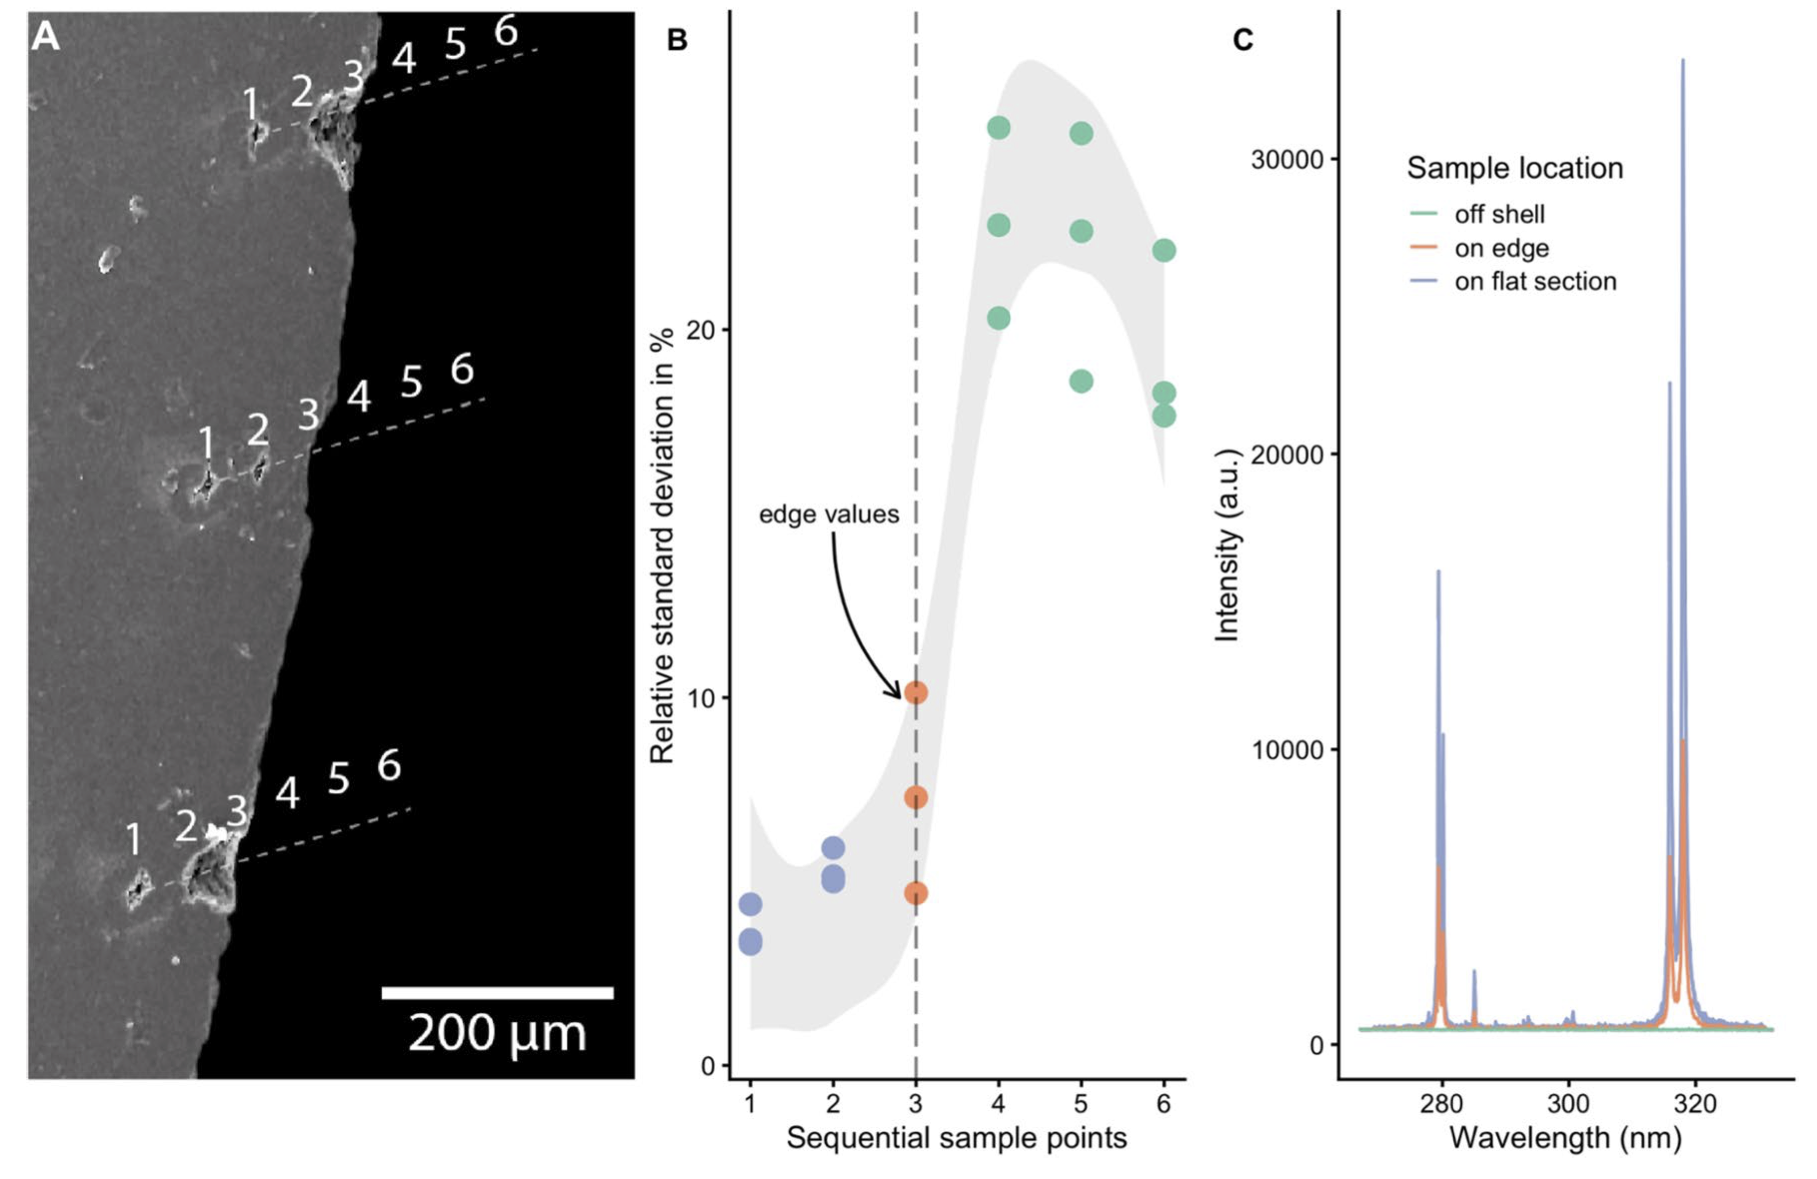
- SEM Analysis: A secondary electron microscope (SEM) analysis of the irradiated shell sections revealed the precision of our LIBS application, further validating our methodology.
- Interdisciplinary Applications: This study not only advances our understanding of marine biology but also has significant implications for paleoclimatology and archaeology.
Why This Matters
We can show what it means in practical terms to apply LIBS to a large number of shell specimen. How much time does it really take, what are the benefits or downsides and how consistent is the data that we are getting out of it? Particularly the data quaility from edge values is important for archaeologists aiming to find out about the season of death, when people were collecting the animals (see Figure 2 below). The information we’ve obtained from this study will aide us in carrying out large-scale shell analyses from future sites of the project with thousands of specimens. This knowledge is also vital for planning future steps as we seek new research applications and archaeological questions across the world.
Data availability
All data needed to evaluate the conclusions in the paper are present in the manuscript. All underlying data files, can be found in an OSF repository at https://osf.io/jur2d/ as well as a GitHub repository at https://github.com/Niklas-palaeo/LIBS_System-2023/. The data itself is citeable using this DOI:10.17605/OSF.IO/JUR2D.